Editor’s Note: DataPlus is MMP’s very first sponsor and I want to thank Frank and his crew for their support! If you would like to sponsor this blog and have over 10,000 readers a month see your flash ad, contact me via email at marypatwhaley@gmail.com.
___________________________________________________________
The old saying “If you can’t measure it, you can’t improve it” certainly holds true in medical practices today. With falling payer reimbursement it is more important than ever to collect every single dollar your practice is due.
Most practices have sought additional income streams by adding ancillary services. Paying close attention to data can improve decision-making for such services and can dramatically improve revenue without adding any providers or even new patients!
Having ready access to the elusive data within practice management systems can be difficult, but most systems can report the basics. It is imperative that data is trended over a period of time so that trends can be spotted, benchmarks compared, and improvement plans developed. Measuring data and comparing it to the MGMA Cost Survey (find it at mgma.com) is one of the best places to start.
1. Collection Rates/Ratios: Two collection rates are measured in medical practices. One is gross collections and the other is net collections, the latter being the most important.
A gross collection rate is payments divided by charges and will depend on an artificial number – how high the charges are set above negotiated allowables – making it not particularly meaningful.
A net collection rate, however, provides a means to benchmark the health of collection efforts. Net collections, simply stated, demonstrate what percentage of collectible dollars (after negotiated contract write-offs) a practice is actually collecting. A net collection rate above 95 percent ”“when calculated correctly – denotes a healthy practice.
2. Denials: Denials are a significant portion of the cost of running a practice in that services that are provided but not paid for reduce the profitably of those that are. Accurately identifying denials and the reasons for them can help prevent them in the future, thus increasing productivity and lowering expenses. Identifying denial trends by specific payer or payer group, by CPT code, and by origin ”“ whether at the front desk, with coding errors, or in credentialing ”“ is equally important.
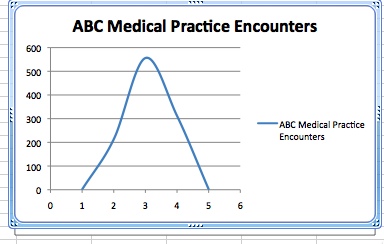
3. Evaluation & Management (E & M) Bell Curve: “Overcoding” and “undercoding” are commonly used terms, but how are they measured? Bell curve trending of E&M data can quickly identify areas where providers may be under coding, resulting in lower revenues, or over coding, resulting in the potential for audits. The difference between a Level 2 and a Level 3 E&M code can mean thousands of dollars in losses per provider per year. Documentation is critical to demonstrating the level of care provided to each patient.
The traditional primary care bell curve below demonstrates that level 3 visits typically comprise about 50% of your established patient encounters, level 2 and 4 visits together about 20% each, and level 1 and 5 visits together about 10%. When plotted on a graph and drawing a line between each, the shape resembles a bell.
4. Bad Debt: Bad debt is defined as dollars that could have been collected, but were not. Break this category into controllable factors and non-controllable factors. Issues that you should have been able to control are timely filing write-offs, credentialing errors, lack of follow-up, and incorrect information provided by the patient. Non-controllable issues are bankruptcy, patient failure to pay, and payers retroactively denying coverage due to unpaid premiums.
Reducing bad debt by just two percent can mean tens of thousands of dollars to the bottom line of a practice. The ability to quickly identify bad debt trends facilitates the development of an improvement plan.
5. AR Days: AR (accounts receivable) days are a measurement of the average time a dollar stays in an accounts receivable before being collected. The ability to measure, benchmark, and lower AR days provides a means to a significant increase in revenue. Some best practices that reduce AR days are filing insurance daily, sending statements daily, collecting appropriately at check-in and check-out, working denials quickly, discounting self-insured for time of service payment in full, and using an eligibility tool to check every single patient’s insurance.
6. Encounters: Accurately reporting and separating encounters for most practices is an arduous task of counting fee tickets or using tick sheets. Few practice management systems accurately provide this information. An encounter is much more than a service code. Being able to segregate office encounters from surgical cases, and reporting by payer, time, and location can help identify opportunities for improvement.
7. Referral Sources: It is fundamentally prudent for specialty practices to know the origin of patient referrals. This data is rarely reliable or easily created in most practice management systems. Practices need to know not only the source of patient referrals, but also what type of patients (by insurance, by procedure, etc.) are being sent by those sources, and if the referrals from a particular source have increased or decreased over time.
8. Payer Mix: It is not uncommon for practices to drop payors due to perception, and not because of actual data or trends. Emotions sometimes come into play and can result in a provider demanding that a payer be dropped because their rates have changed (or other perceptions). This simply does not make sense. Being able to accurately produce and graph data on major payers without hours and hours of work is of high strategic value to a well-planned business decision. It can answer questions about the impact on a practice if a particular payer is dropped, or how those patient slots would be filled. Remember to keep adding payers to the practice when feasible; the loss of your largest payer can be minimized if many smaller ones are on board.
9. Under Payments: One of the more significant ways to improve a practice’s revenue is the swift and accurate identification of carrier underpayments. Identification of underpayments is not simply comparing the payment to an allowable fee schedule. Practice management systems that have any type of payment audit functionality commonly do not take into account circumstances such as modifiers, or multiple surgical procedures that payers routinely inaccurately apply, causing underpayments. Having a system to automatically and systematically apply these rules is essential. MGMA states that providers are underpaid an average of six percent of revenue. What does that mean to a practice? The numbers can be astounding to a surgical group, and the identification and collection of those underpayments can be insurmountable.
10. Fee Schedule Comparison: It can be difficult to determine what payers are reimbursing by contract for specific codes or ranges of CPT codes. The ability to have immediate and accurate access to this data is crucial in payer negotiations. It is important to remember that the payer already has this information and is betting that the practice does not!
It is now more important than ever for practice managers to have access to the critical information outlined above. It is also important to note that not just any one of the above Key Practice Indicators should be used to determine the financial health of your practice, but all, or a combination of them.
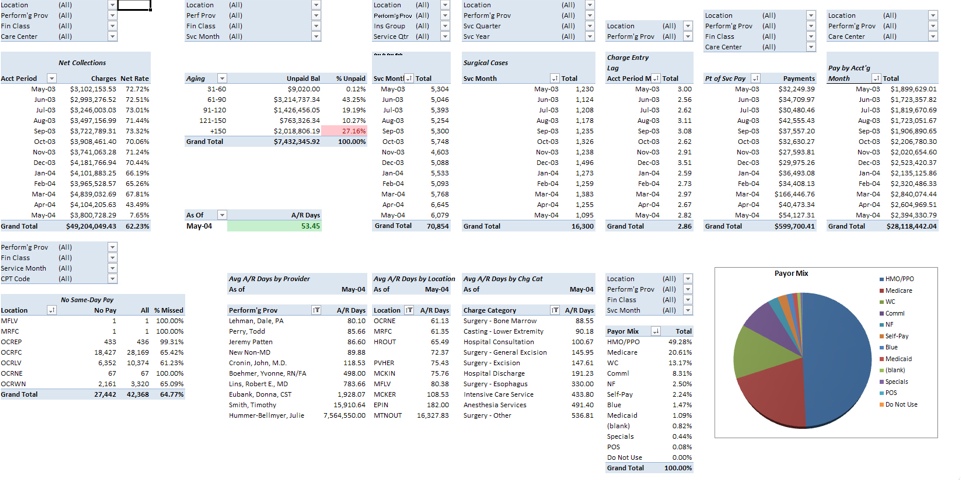
The buzzword among practices today is “Dashboards.” The ability to have these Key Practice Indicators in one simple report is proven to increase efficiency, as well as provide a meaningful way to present information to providers. One example of a dashboard is below.
About the author: Frank Trew is the Founder and CEO of DataPlus and has over 25 years of practice management experience and has served in executive positions in large and small practices. In 1999, as the COO of a large orthopaedic group in Nashville, he was frustrated by an inadequate access to data that limited his ability to measure and improve the bottom line. The development of a data warehouse was the solution.
 In 2000, after hearing how this data was a key practice management tool, many of Frank’s peers also wanted to use it improve their practices. DataPlus was formed as a result and has been providing MegaWest, HealthPort, and Centricity users with this unique tool ever since.
Employing a simple to use “point and click, drag and drop” reporting tool, along with an advanced Contract Management and Revenue Recovery System, DataPlus provides key management data across all specialties and throughout the United States.
Frank invites readers to visit the DataPlus website at www.mydataplus.com. Frank may be contacted via email at ftrew@mydataplus.com or by telephone at (888) 688-3282.