Happy New Year!
What will your practice achieve in the coming year? Many people make resolutions to improve themselves when the new year rolls around, but what about your practice? With all the changes in the industry, it can be tempting to just “hang on tight” through all the speculation and uncertainty, but technology and strong leadership will allow the highest performing practices and groups to get ahead and cement their market position in trying times.
To help your practice be a leader in the market, Manage My Practice is presenting a series of 12 articles outlining strategies, (or “Resolutions”, if you will) to take your practice to the next level in the coming year. Look for the next article on Thursday, and share your practice’s resolutions, and ideas for 2012 below! Don’t want to miss a single article? Type your email address in the upper right-hand corner box and get the articles fresh off the presses into your inbox.
What is a Practice Dashboard?
You’ve probably heard the adage ‘You can’t manage what you can’t measure!” The Dashboard is a way to capture key pieces of data in your practice and demonstrate your management skills to your stakeholders.
A Practice Dashboard is a one-page look at the key indicators being monitored that are necessary for the practice to thrive financially. As an administrator, I have typically presented the Dashboard Report (sometimes called a Snapshot Report) to the physicians at the monthly meeting. The Dashboard keeps the physicians operating at a high level and usually keeps them from descending into the deep detail that can derail a monthly meeting like nobody’s business!
How can I create my own Practice Dashboard?
Some Practice Management (PM) Systems have a dashboard built into the system, but many don’t. It’s not too hard to create your own dashboard by running some reports and entering the data into your Dashboard on Excel, Word, or PowerPoint, or OpenOffice equivalents.
What should be included in my Practice Dashboard?
There are a couple of basics, then there are lots of extras from which you can select the measures that will be important to your group. Here are the basics:
-
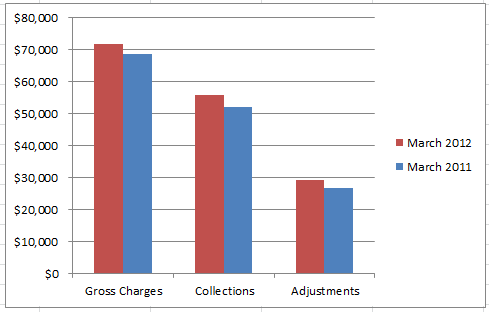
Gross charges, collections and adjustments for the month and year-to-date (YTD) and the same month last year and YTD last year.
What is it?
These are the basic measures of the productivity of the month (charges), but keep in mind that the collections and adjustments are from work that was produced sometime between 15 days and 15 months ago. As long as you realize that, it is fine to consider collections and adjustments a “monthly measure.” If you have ancillaries, you will break these out separately – radiology, lab, allergy, sleep center, etc.
Where do I get it?
This information should come directly from your practice management month-end report, and once you’ve been producing your dashboard for awhile, you’ll be comparing previous years from your own reports. You may also collect the previous year’s information from old reports, some financial statements have this, some physician compensation reports have this information, and some PMs allow you to run this information in summary form from previous months.
-
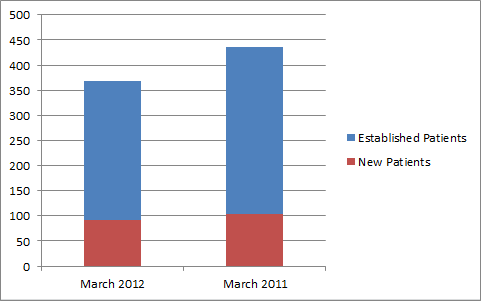
Number of new patients and established patients this month and YTD and the same month last year and YTD last year.
What is it?
It is the measure of your practice’s health. If you do not have any new patients coming to the practice, your practice will slowly die. Only physicians on a schedule to slow down and/or retire should close their practice to new patients. On the other hand, if you don’t have enough established patients coming to the practice, you may be in danger of doing too much phone medicine and not seeing patients face-to-face often enough. Depending on the specialty, you may have many new patients and few established (surgical specialties) and patients only need to return to see you annually or only if they have problems.
Where do I get it?
Hopefully your practice management system will calculate this information for you, but some systems still don’t. You may have to have staff complete a worksheet counting patients daily.
I also like to list the number of patients who left the practice, broken into a few categories such as “moving”, “changing doctors” and “declined to say” and of course “discharged from the practice.” Some practices also like to track # of deceased patients.
-
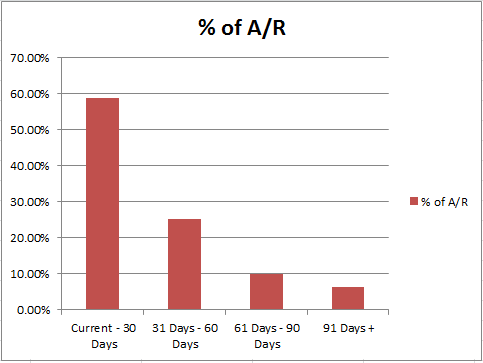
Aged Accounts Receivable (typically written as A/R)
What is it?
It is a breakdown of the % of dollars in standard categories (Current- less than 30 days, 31 – 60 days, 61 – 90 days, and 91 days and over) and the measurement of how long it takes for a service you’ve provided to be paid in full. For Medicare patients, you should receive payment 15 days from their receipt of a clean claim. Most states have prompt payment laws that require a clean claim to be paid in 30 days for commercial carriers. What ages monies past 60 or 90 days are patients on payment plans, and any services that payers have “under review” for payment. Also, if your claim is denied and you need to appeal it, or if your claim wasn’t clean to start with, most likely it will run into 60 or 90 days.
Where do I get it?
Every PM system will print out your Aged A/R as a part of your end-of-month routine, and hopefully, on-demand whenever you want it. Your aged A/R is a snapshot of the money that is owed to the practice at any moment in time, so it changes every time a service is provided and every time a patient or payer gives you a payment.
Another indicator that goes with your Aged A/R is your days in A/R. Most practices strive for days of <30. This is an easy number to calculate.
- Arrive at your average daily charges by dividing your charges for the last 3 months by 90.3 days.
- Divide your total A/R by your average daily charge.
- If your average daily charge is $1,000 and your total A/R is $60,000, your Days in A/R is 60. It takes you 60 days to receive payment in full for a service.
-
Collection % – how much of what you can collect, do you collect?
One of the most talked about and least understood metrics is the collection %. There are two reasons it is misunderstood.
One is because most people talk about a monthly collection percentage, as if the money you collect this month relates to the charges you billed this month. Some of it does – the co-pays, deductibles and co-insurance definitely applies to this month’s services, but the insurance payments most often do not. This is how you can collect more than 100% in a month – by having lower charges and higher collections, you can achieve more than 100% collections! Not. Nope. No such thing.
Over the course of 12 months, it tends to even out, so you can use your annual collection % with a degree of confidence, but the very best way to know what you are collecting is to use a report that applies the payments (regardless of when they arrive) to the services in the month they were rendered. If your PM system doesn’t have this report, ask for it.
The second is because gross charges are not necessarily “real” numbers. Most practices set a retail fee schedule at a point to capture the most any payer will reimburse them. So, a practice could set its fees anywhere and never really expect to charge or to collect what I call “funny money.”
What is it?
Your collection percentage is your net collections divided by your net charges. Net collections = gross collections minus refunds. Net charges = charges minus any contractually obligated write-offs. Contractual write-offs are the difference between the practice fee schedule and the allowable fee schedule you’ve agreed to accept. A 95% or better collection rate is considered excellent, depending on what, if any, other write-offs you include with your contractual adjustments.
Where do you get it?
If you have only one category of write-offs (sometimes called adjustments) in your PM system, you are going to find it hard to calculate this percentage. You may want to introduce new write-off categories for 2012 and have your staff post contractual adjustments to one category and other types of adjustments to several other new categories. See my article here for in-depth information on creating write-off categories and managing write-offs.
If you have your contracted adjustments separated, follow the formula above to get your collection percentage. Some practices will use a rolling 12-month figure for their collection percentage (i.e. ignoring the most recent month, use the last 12 month’s cumulative total net collections divided by the total net charges.)
Here are optional dashboard items you can use:
- New patient referral breakdown by type (referred by doctor, patient, employee, website, direct mail, TV, radio, yellow pages, etc.) We’re going to be talking more about this in one of our other “12 for 2012”, so stay tuned.
- Cumulative money turned over to third-party collectors and money collected. I don’t think this is a great metric, because if your collection agency is collecting a lot for you – why weren’t you able to do it yourself?
- Status of any loans (remaining principal) or line of credit outstanding
- Sales and returns, if you are selling anything in the practice – medication, vitamins, supplements, books, beauty products, etc.
- Appointments – % of appointments filled, % of no-shows, % of appointments booked the same day or the day before.
- Money collected at check-in and check-out versus what should have been collected
- What number makes your physicians crazy that you could measure and manage?
A few other suggestions for your Dashboard:
- Don’t use so many metrics that you have to print the report extremely small or make it into a 3 or three page report. A Dashboard Report is one page. Control yourself.
- Use a variety of charts and graphs to illustrate your key indicators – remember that many people find it difficult to absorb a lot of written or numeric information in a short amount of time, but using charts will make it easier.
- Use color to give visual cues – if the areas that you are doing well are in green and the ones you are not doing well in are in red, it will help your audience to focus on the important numbers.
- Make sure you know “why” before you introduce your report. Why are we doing better? Why are we doing worse? What can been done to improve the numbers?
- Some physicians like to get their monthly Dashboard before the meeting so they have time to review it and jot down their questions. Some might also appreciate going over the Dashboard one-on-one with you before the meeting so they feel more in control of the situation.


